When monitoring the performance of Domain Controllers there are certain counters over and above the default ones that will provide you with advanced information to ensure that they are sized and performing correctly. These are the JET Database Performance Counters.
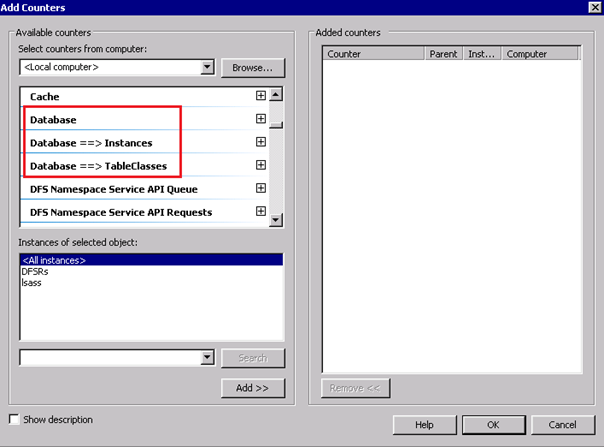
When enabled they will show up as Database objects, containing many counters within, as per the following screen shot:
So what extra counters does this give us and how can they be used?
The following table shows a sample of specific counters directly related to the Database with some guidelines to help you with monitoring performance so that you can make decisions on sizing requirements:
|
Object\ Counter |
Description |
Guideline |
| Database\ Cache % Hit | Indicates the percentage of page requests for the database file that were fulfilled by the database cache without causing a file operation. | This counter should show activity over time. If it does not, it usually indicates that the server does not have enough free physical memory and you should consider adding more memory. |
| Database\ Cache Page Fault Stalls/sec | Indicates the number of page faults (per second) that cannot be serviced because there are no pages available for allocation from the database cache. | This counter should be zero. If it is not, it usually indicates that the server needs more memory. |
| Database\ Cache Page Faults/sec | Indicates the number of page requests (per second) for the database file that require the database cache manager to allocate a new page from the database cache. | This counter should be as low as possible. If it is not, it usually indicates that the server needs more memory. |
| Database\ Cache Size | The amount of system memory used by the database cache manager to hold commonly used information from the database file(s) to prevent file operations. | If the database cache size seems to be too small for optimal performance and there is very little available memory on the system (see Memory/Available Bytes), adding more memory to the system may increase performance. If there is a lot of available memory on the system and the database cache size is not growing beyond a certain point, the database cache size may be capped at an artificially low limit. Increasing this limit may increase performance. |
| Database\ File Operations Pending | Indicates the number of reads and writes issued by the database cache manager to the database file or files that the operating system is currently processing. | This counter should be as low as possible. If it is not, it usually indicates that the server needs more memory or processing power. |
| Database\ File Operations/sec | Indicates the number of reads and writes (per second) issued by the database cache manager to the database file or files. | This counter should be as low as possible. If it is not, it usually indicates that the server needs more memory. |
| Database\ I/O Database Reads/sec | The rate of database read operations completed. | |
| Database\ I/O Database Writes/sec | The rate of database write operations completed. | |
| Database\ I/O Log Reads/sec | The rate of logfile read operations completed. | |
| Database\ I/O Log Writes/sec | The rate of logfile write operations completed. | |
| Database\ Log Record Stalls/sec | Indicates the number of instances (per second) that a log record cannot be added to the log buffers because the buffers are full. | This counter should be as close to zero as possible. If it is not, it usually indicates that the server needs more memory and that the size of the log buffer may have become a bottleneck. |
| Database\ Log Threads Waiting | Indicates the number of threads waiting for data to be written to the log so that an update of the database can be completed. | This counter should be as low as possible. If it is not, it usually indicates that the server needs more memory or a faster hard disk. |
| Database\ Table Open Cache Hits/sec | Indicates the number of database tables opened (per second) by using cached schema information. | This counter should be as high as possible. If it is not, it usually indicates that the server needs more memory. |
As this information is so valuable I have never understood why Microsoft doesn’t enable them by default as part of the “DCPROMO” process. It’s also interesting that Microsoft does not recommend this to customers as part of their AD Risk Assessment Program (AD RAP). Enabling these should be a no-brainer for anyone that considers themselves an AD Specialist. It’s certainly part of my best practice.
So how do you enable these counters? You just need to set some registry values and import the performance counters using the lodctr.exe (Load PerfMon Counters) tool. Pretty simple really.
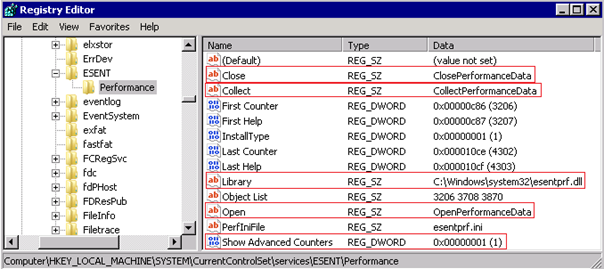
The following screen shot shows the registry values required. This was taken from a Windows 2008 R2 Domain Controller:
Simply pushing this out using a .reg file, Group Policy ADM or ADMX template, or Group Policy Preferences (GPPs) is not going to work because you need to determine the Library value (location of the esentprf.dll library), which is different across Operating Systems, and you also need to execute the lodctr.exe command to import it. So I wrote a script!
The script can be executed by various means:
- Run at time of Domain Controller build.
- Added as a Startup Script from the Domain Controllers Group Policy.
- Setup as a Scheduled Task, which can also be pushed out via a Group Policy.
Note that you may see many articles referencing a “Squeaky Lobster” value instead of “Show Advanced Counters”. There is quite a bit of history around the “Squeaky Lobster” value, but it is being phased out in favour of the “Show Advanced Counters” value.
Here is the EnableJETDatabasePerfCounters.vbs script:
' This script will enable the JET Database Performance Monitor (perfmon) counters for
' Active Directory. It can either be:
'   1) Run at time of Domain Controller build
'   2) Added as a Startup Script from the Domain Controllers Group Policy
'   3) Setup as a Scheduled Task

' Once this has been set open Performance Monitor (perfmon.exe) and you will see a
' Database object that contains many useful counters related to the JET Database.
' For Example: The Database Cache % Hit counter should be used to assess if the Domain
'              Controller has enough memory.

' Note that you may see many articles referencing a "Squeaky Lobster" value instead
' of "Show Advanced Counters". There is quite a bit of history around the "Squeaky
' Lobster" value, but it is being phased out in favour of the "Show Advanced Counters"
' value.

' This script will backup the existing perf counts to a file called PerfCounterBackup.ini
' located in the %SystemRoot%\debug folder.

' Release 1.0
' Written by Jeremy@jhouseconsulting.com 25th September 2012.

Option Explicit

Dim objShell, strSystemRoot, strKey, strJETperfcounterLocation, strCommandLine

Set objShell = WScript.CreateObject("WScript.Shell")

strSystemRoot = objShell.ExpandEnvironmentStrings("%SystemRoot%")

strKey = "HKLM\system\currentcontrolset\Services\ESENT\Performance"

' JET perf counters
objShell.RegWrite strKey & "\Open", "OpenPerformanceData", "REG_SZ"
objShell.RegWrite strKey & "\Collect", "CollectPerformanceData", "REG_SZ"
objShell.RegWrite strKey & "\Close", "ClosePerformanceData", "REG_SZ"
objShell.RegWrite strKey & "\Library", strSystemRoot & "\system32\esentprf.dll", "REG_SZ"
objShell.RegWrite strKey & "\Show Advanced Counters", 1, "REG_DWORD"

' Set JET perf counter file location
If CInt(OSVersion()) >= 6 Then
  strJETperfcounterLocation = strSystemRoot & "\inf\ESENT\0000\esentprf.ini"
Else
  strJETperfcounterLocation = strSystemRoot & "\System32\esentprf.ini"
End If

' Backup Perfmon Counters
strCommandLine = "%comspec% /c lodctr.exe /s:" & strSystemRoot & "\debug\PerfCounterBackup.ini"
objShell.Run strCommandLine

' Import Jet perf counters
strCommandLine = "%comspec% /c lodctr.exe " & strJETperfcounterLocation
objShell.Run strCommandLine

Set objShell = Nothing

wscript.quit(0)

Function OSVersion()
  Dim strComputer, oWMIService, colOSInfo, oOSProperty, strVersion
  strComputer = "."
  Set oWMIService = GetObject("winmgmts:\\" & strComputer & "\root\cimv2")
  Set colOSInfo = oWMIService.ExecQuery("Select * from Win32_OperatingSystem",,48)
  For Each oOSProperty in colOSInfo
    strVersion = Left(oOSProperty.Version,3)
  Next
  OSVersion = strVersion
  Set oWMIService = Nothing
  Set colOSInfo = Nothing
End Function
Another interesting reference from a Microsoft TechNet blog: NTDS performance counters missing
Enjoy!


